
RETECHNOLOGY PREMIUM MARKETPLACE RELATED PRODUCTS | WEBINARS | SPECIAL OFFERS


You are viewing our site as an Agent, Switch Your View:
Agent | Broker Reset Filters to Default Back to ListReal Estate Market Report to Send to Leads: The Heavy Hitter
December 09 2015
 We already know from multiple surveys that people who visit real estate websites want to search listings, at least 90% or more say this. So, they are seeking information about the market. Now a question. What appeals to EVERY type of visitor who is on your site seeking information? It is, without a doubt, market statistics:
- Potential sellers want to see how the market is doing, if homes are selling well, and what kind of discounts-to-list the market is experiencing.
- Buyers are on the other side, checking out what homes are selling for and trying to situate their needs in the marketplace and check affordability.
- Investors just want to know everything about market movement.
- Other professionals, such as appraisers and title company employees, love a good market report.
These are the general reasons why all of your visitors will have an interest in market statistics. The importance of offering reports as a lead generation tool can't be overstated. Also, with the time between starting online research and either listing or buying stretching into months on average, you must keep your identified prospects and not lose them to the competition before they act.
What's In This Report and Why is it of Value?
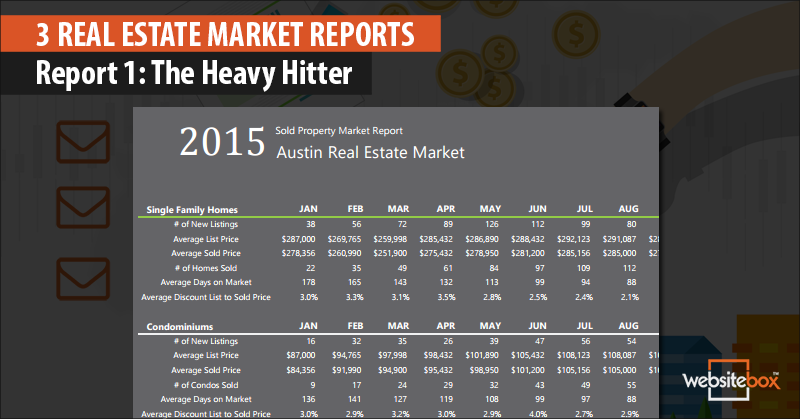
Let's analyze this particular report and the valuable information it provides. We call it 'The Heavy Hitter' because it's a comprehensive report that jam-packs a lot of useful real estate market data into a report that is valuable to anyone who is in the market to buy or sell property.
First, it is 12 months of sold homes and condominiums history. It is sliced and diced to provide insight into the market action over time.
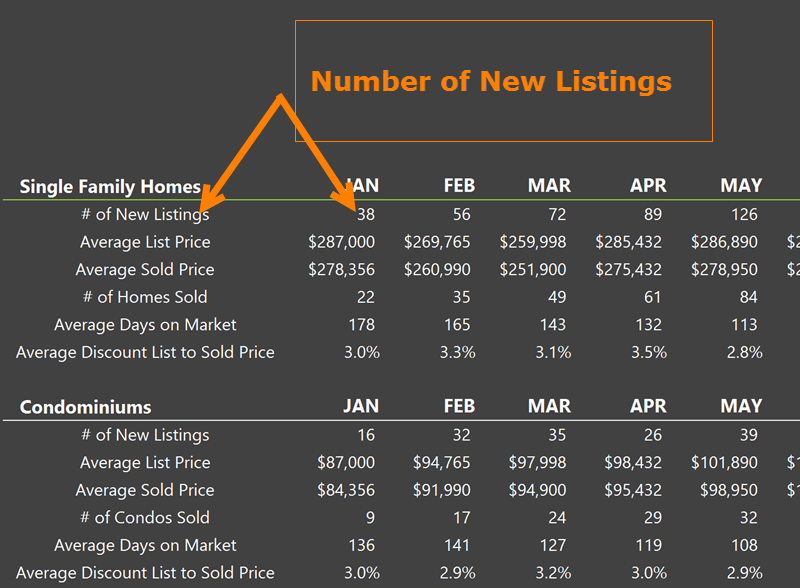
This can help with looking at the market from a seasonal perspective. Also, comparing average list prices, sold prices and discounts based on how many listings are entering the market can be helpful. Sellers will see when most other sellers are listing, and they may want to "beat the busy months" by listing earlier.
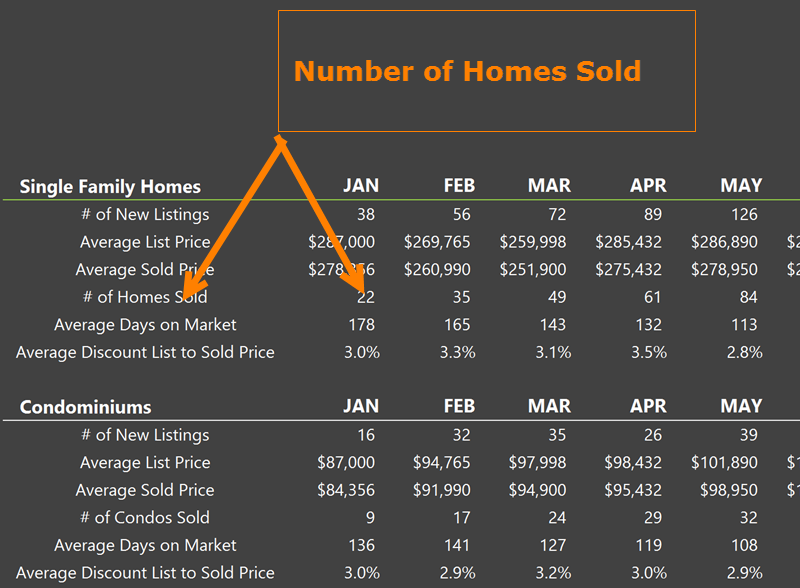
Let's jump down a couple of items because there is some great comparison ability here. The number of homes sold can be looked at in relation to the number listed. As an example, in January the number of homes sold related to new listings was 58%. In March, it was 68%, and almost double the number of new listings came on the market. So, one assumption may be that the market is pretty hot in March to absorb a higher percentage of new listings.
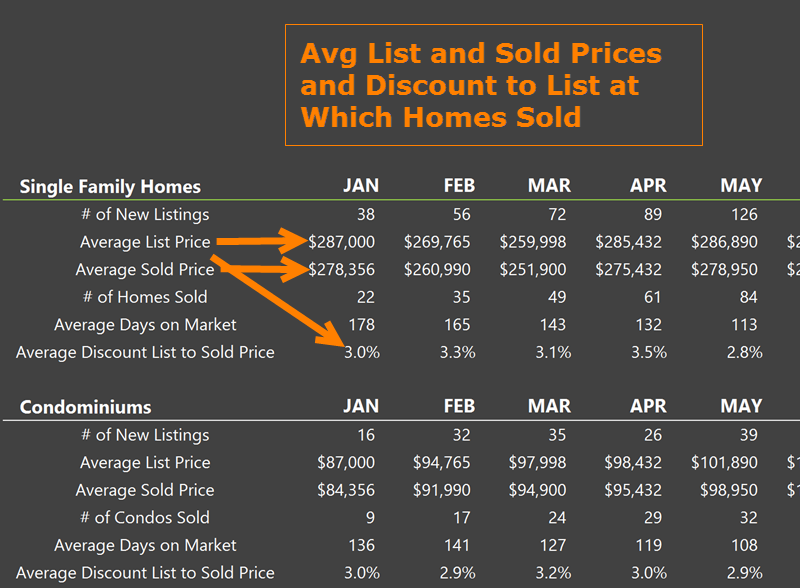
This is some of the most valuable information in the report. Using the average list price and average sold price, the discount at which homes sold is calculated. In this market, at least from January through May, discounts are running at 3% or higher, except for May. We see that competition must have heated up a bit, and it's also the highest number of sales in any month in this shot. Let's look at a few more months:
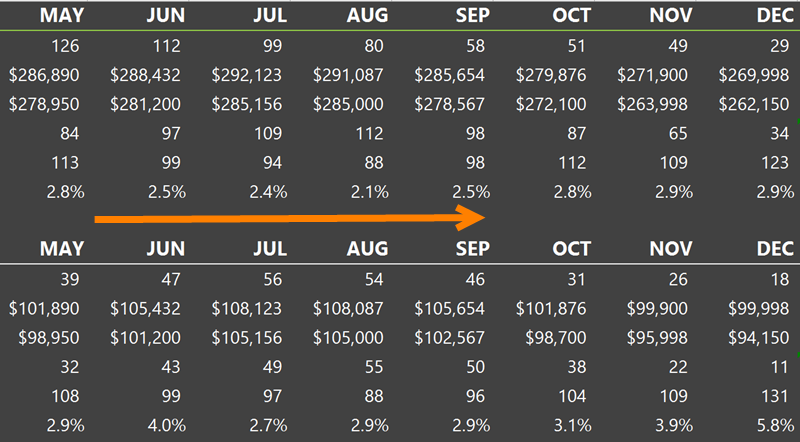
We see that the summer is the hot season for this market. The discounts to list drop from May to the lowest level in August. Then we see them begin to pick up again in September. So, a seller would want to get their home on the market for these months to get their best price. A buyer may want to buy before or after these summer months to get a better deal.
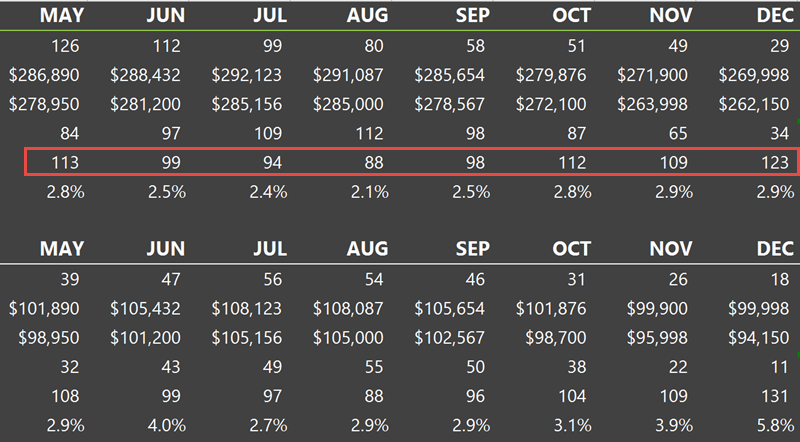
The boxed area is the number of average days on market for the sold homes. We see that they move faster in the summer. So, higher prices from more competition was a summer market factor.
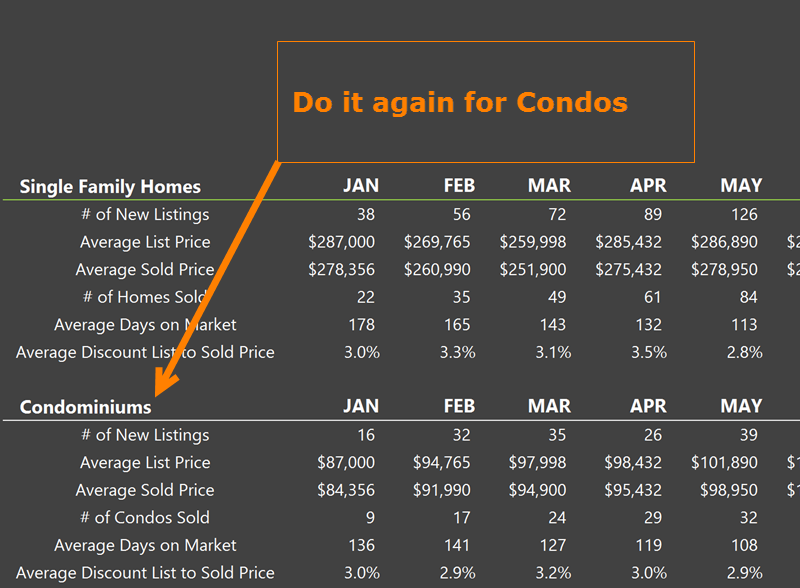
Then, all of the same calculations are separately done for condominiums. Not mixing them helps the different property type buyers to get a more accurate picture of the market for their uses.
![]()
And,of course we have the attention-getting box at the top with the average sold home price for the entire year. Want the template for this report? Click on the link below!
How Do You Populate this Report?
The report is an Excel spreadsheet, and you'll be entering the numbers directly into the spreadsheet cells. Just click on a cell and put in the number. We're not talking about the calculated cells. The big box at the top and the Average Discount List to Sold Price will calculate for you once all of the other data is entered.
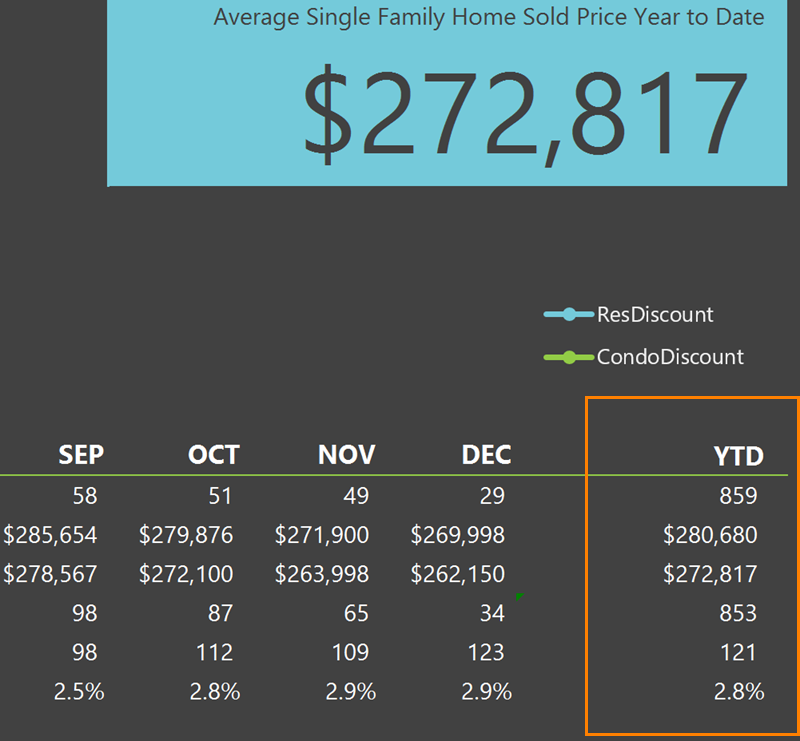
The Year to Date data will also calculate for you. So, where do these numbers come from?
Today's computerized MLS systems generate all sorts of reports. They vary, so I can't give you specifics here. But, you will be able to find all of these numbers by pulling individual date range reports. You may have to do the average calculation for list, sold and days on market, or you may be able to export your MLS report to a spreadsheet and do it there with a formula. The good news about this report is that you only do 12 months one time. After that, you can just enter one month at a time.
You'll actually be delivering the report we built via email. Let's talk about that now.
Four-part Email Series for Market Reports
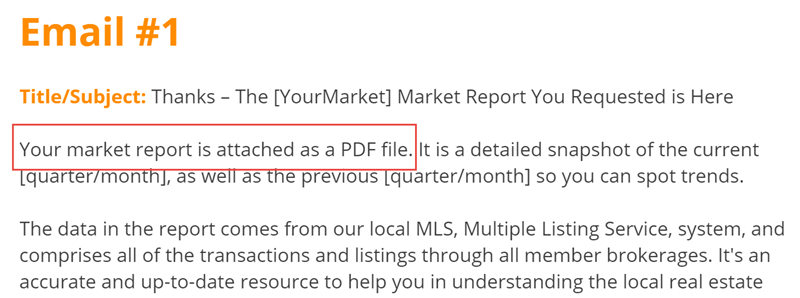
We don't want to lose them, so we follow up with a series of emails. The first one delivers the report we built in Excel. However, you print that to a PDF file for delivery. It's best not to try to deliver spreadsheet files for compatibility reasons. Convert it to a PDF with free software or online and attach it to the first email that starts out like this:
Get the text of this 4-part email series in this blog post. The second email offers more detailed information, and the third tells them you'll send them monthly or quarterly reports to keep them informed and on top of the market. There is a call to action in every email as well.
To view the original article, visit the WebsiteBox blog.