
RETECHNOLOGY PREMIUM MARKETPLACE RELATED PRODUCTS | WEBINARS | SPECIAL OFFERS


You are viewing our site as an Agent, Switch Your View:
Agent | Broker Reset Filters to Default Back to ListForecasting a Sale: A Real Estate Market Report to Send to Clients
December 16 2015
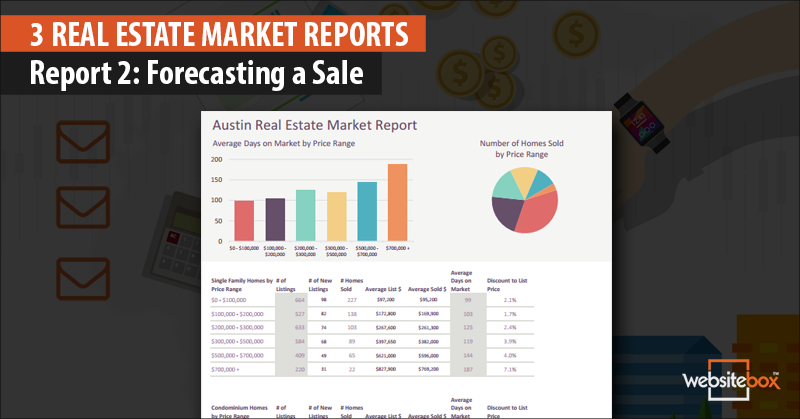 This is the second report in our 3-part series in which we give away 3 free real estate market reports (see part one here). While all of them have some common data, it's presented differently in each. This one also has single family and condominiums treated separately. This one has price ranges, which the first one does not. While the first report is great to send to a lead who is seeking general information, this report would be great for a home seller who wants to know how long it will take to sell their home.
What you see in the image above is created for you in the Excel spreadsheet once you fill in the data cells. So, just enjoy that great colorful representation and don't worry about the magic that makes it happen.
The Data Cells
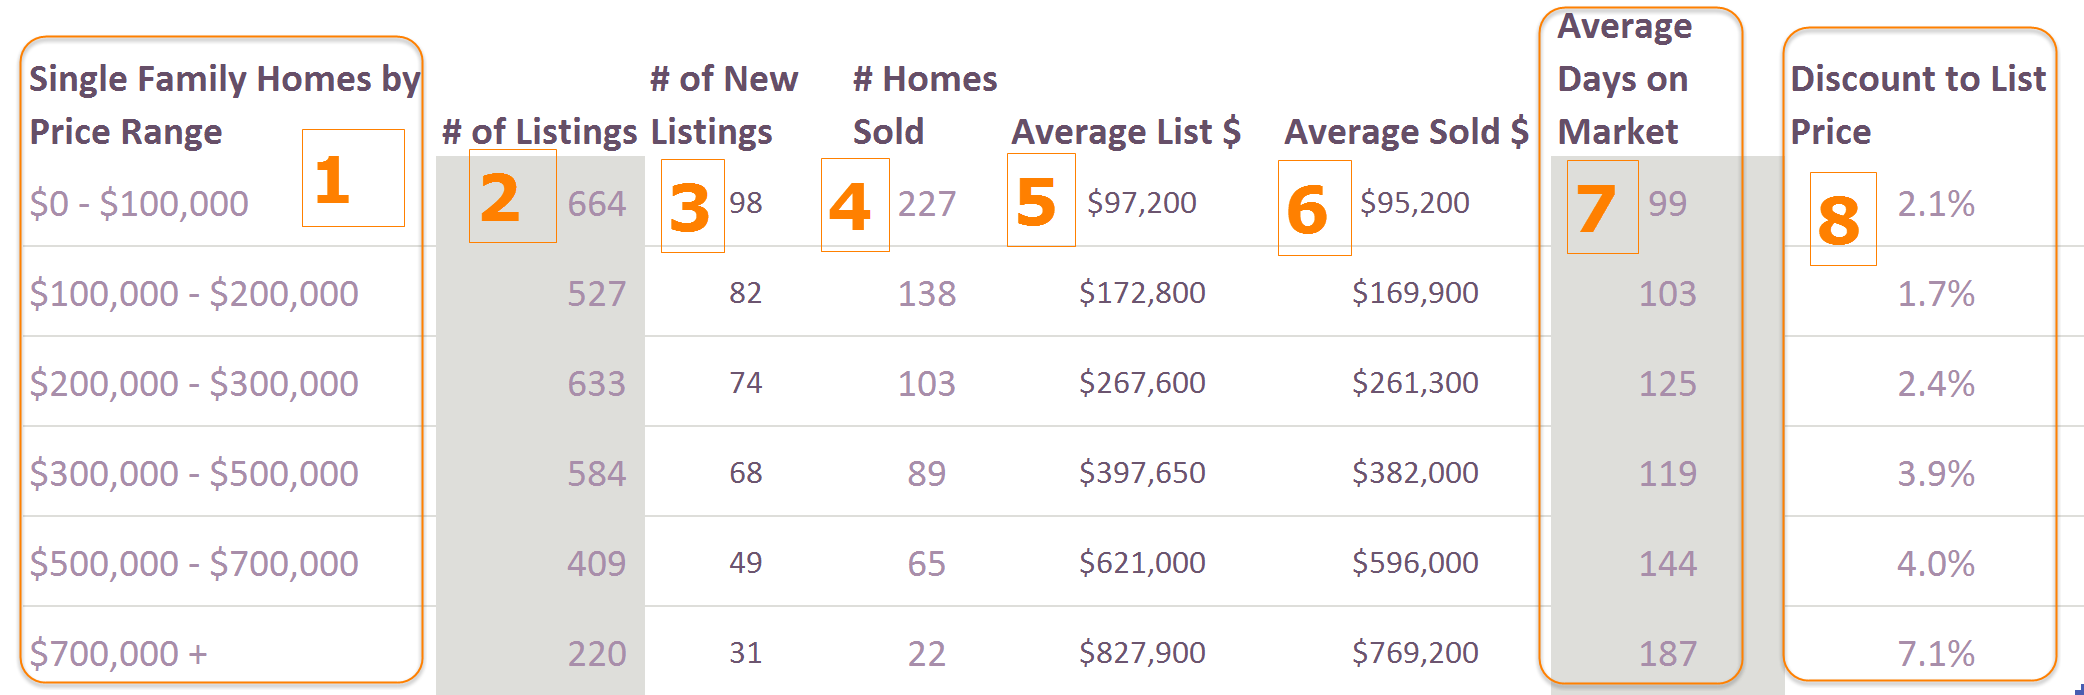
Let's talk about the columns and where you'll get the data. Of course, everything will come from your MLS reporting system. How your MLS will offer up the numbers will differ, but all of this should be there. You can choose the time frame for this data, either a month or maybe the previous quarter. This is all data your site visitors will find of value from whatever perspective they are looking—buyer, seller or investor. *Important: Remember that every item on the next page after #1 is going to need to be pulled for just the price range in that line.
1. Price Range - You set these where you want them. Markets differ, so you may want to use lower and tighter price ranges. It doesn't matter, just set them where you want them and adjust your MLS searches to grab the data by each range.
2. # of Listings - Obviously, this changes almost daily, so you'll need to choose a day to use. The last day of the period is as good a choice as any. If you're doing a monthly, just take the number of homes listed on the last day of the month. Of course, if you're really analytical, you could do every day's listing number, add them up and divide by the number of days.
3. # of New Listings - This one is easier. Just ask for the listings with listing dates between and including the first and last days of the period.
4. # of Homes Sold - This one should be easy. Just ask for the homes sold during the period. Enter the number in the cell.
5. Average List $ - Almost all MLSs have the initial list price field continue to show that price, with another field showing current list if the price has been reduced. What you want here is the average list price for all homes listed in the line's price range.
6. Average Sold $ - Pull the sold homes and average the sold prices for this cell.
7. Average Days on Market - This would be for the sold properties only. Take the average of the sold properties' days on market and enter here.
8. Discount to List Price - This column will calculate for you by subtracting the average sold price from the average list price and dividing that by the average list price. Using the first line, the calculation looks like this:
$97,200 - $95,200 = $2,000
$2,000 / $97,200 = .021, or 2.1%
Then you do the same for the condominium market data.
There is some interesting information here from any prospect's perspective. From a purely analytical perspective, notice that the boxed areas show how, as the prices go higher, the homes stay on the market longer and the discounts off list get bigger.
This report is visually appealing, and the graphs at the top give the viewer a very quick and graphic representation of which price ranges are selling and how long they stay on the market.
Want the template for this report? Click on the link below!
Delivery of the Report
If you're using all three of these reports in the series, you can convert this one to a PDF then attach it to the second email from this article and change the text to tell the prospect that. After all, if they like a little bit of data, another look at a somewhat different set of numbers should be appreciated as well.
To view the original article, visit the WebsiteBox blog.