
RETECHNOLOGY PREMIUM MARKETPLACE RELATED PRODUCTS | WEBINARS | SPECIAL OFFERS


You are viewing our site as an Agent, Switch Your View:
Agent | Broker Reset Filters to Default Back to ListState of the Market: A Real Estate Market Report to Send to Clients
December 23 2015
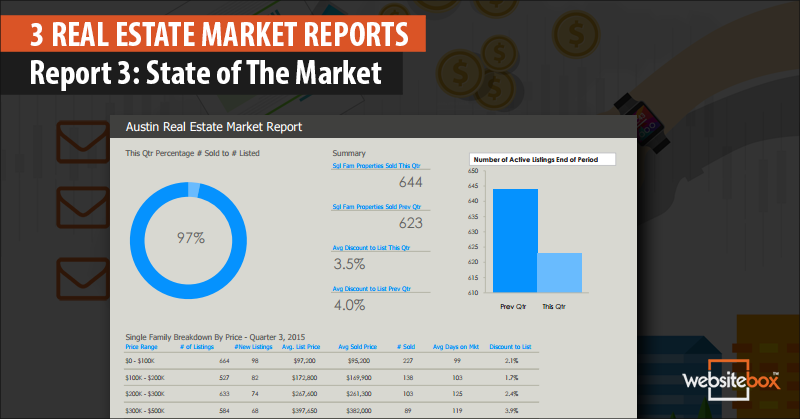 This report is another market snapshot from a quarter-to-quarter comparison perspective. The recently ended quarter is compared to the one before it. This gives the report viewer a view of how the market is moving, which is why we call it 'The State of The Market.' Of course, seasonal fluctuations must be considered as well. Comparing a busy summer quarter with a slower fall quarter requires consideration of the season as a slowing factor.
However, it is good information. Much like our Part 2 report, this one has a graphic overview of consolidated data for the price ranges. We're also doing this for single family, though you could decide to do another one for condominiums.
So, What Data Are We Showing to Compare Quarterly Market Performance?
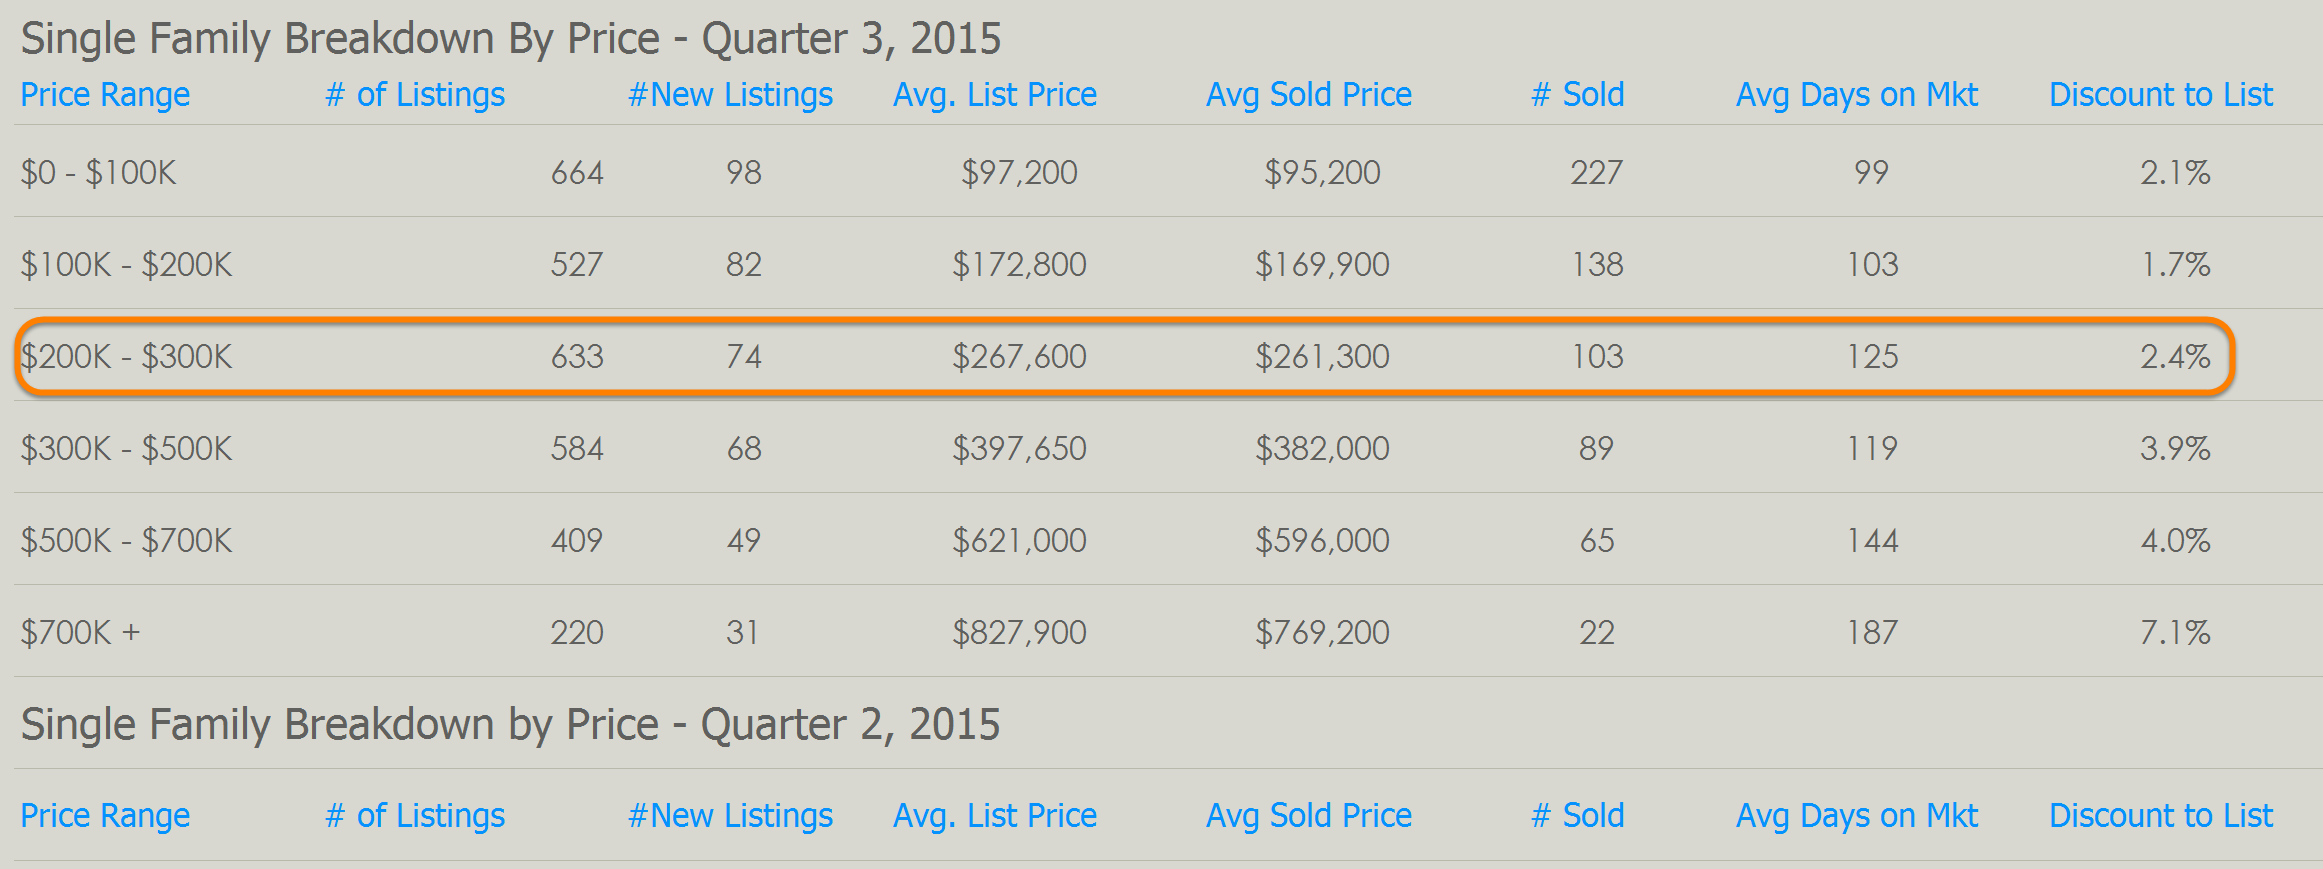
Let's use one line to talk about the columns, the one in the orange box.
Price Range - You decide on how you want to break your report out. Your market may be better displayed with smaller increments of $50,000, rather than the $100,000 shown here. Set them the way you want and pull your data from the MLS by price range.
# of Listings - Obviously, this changes almost daily, so you'll need to choose a day to use. The last day of the period is as good a choice as any. If you're doing a monthly, just take the # of homes listed on the last day of the month. Of course, if you're really analytical, you could do every day's listing number, add them up and divide by the number of days.
# of New Listings - This one is easy to grab out of the MLS reporting system. Just search for all listings with listing date during that quarter. In this case, you would call for listings with listing dates between July 1 and September 30, 2015.
Average List Price - Grab all of the SOLD properties for the quarter and average their initial listing price.
Average Sold Price - Average the sold prices for all homes sold during the quarter. We'll be comparing this with average list price in another column.
# of Homes Sold - This is simply the total number of homes that closed during the quarter. This brings up a note. Don't use contract dates, as sales fall through. You always want to use actual closing dates as sold dates in all of these data pulls.
Average Days on Market - Another simple averaging of the days on market for all properties that sold and closed during the quarter.
Discount to List - You don't have to do anything for this one. The spreadsheet, once you've entered all of the previous numbers into the cells will do this calculation.
(Average List $ - Average Sold $) / Average List $
How it is Delivered
We've already discussed that comparing quarterly performance has value. Where you'll really build your reputation as the market statistical expert is when you've been doing these for a couple of years. Now you will be able to offer year over year versions of these reports for even more in-depth market analysis.
We've discussed this 4-part follow-up email series in the first two parts of this report. By using all three of these detailed reports, you can offer one in each of the first three emails. Then in the fourth you tell them you'll be updating them regularly with new market statistics as tie passes.
To view the original article, visit the WebsiteBox blog.