
RETECHNOLOGY PREMIUM MARKETPLACE RELATED PRODUCTS | WEBINARS | SPECIAL OFFERS


You are viewing our site as an Agent, Switch Your View:
Agent | Broker Reset Filters to Default Back to ListDiscovering Neighborhood Data for Your Clients
April 18 2021
 Finding the right neighborhood for your buyer is easy thanks to the housing, demographic and economic data found within RPR. Here, we'll run you through the basics on how to help your clients zero in on the ideal neighborhood.
Then, we'll show you how to create an RPR Neighborhood Report that will "wow" your clients and, hopefully, help you close some deals.
Let's get started with what you'll find in RPR's Neighborhood section:
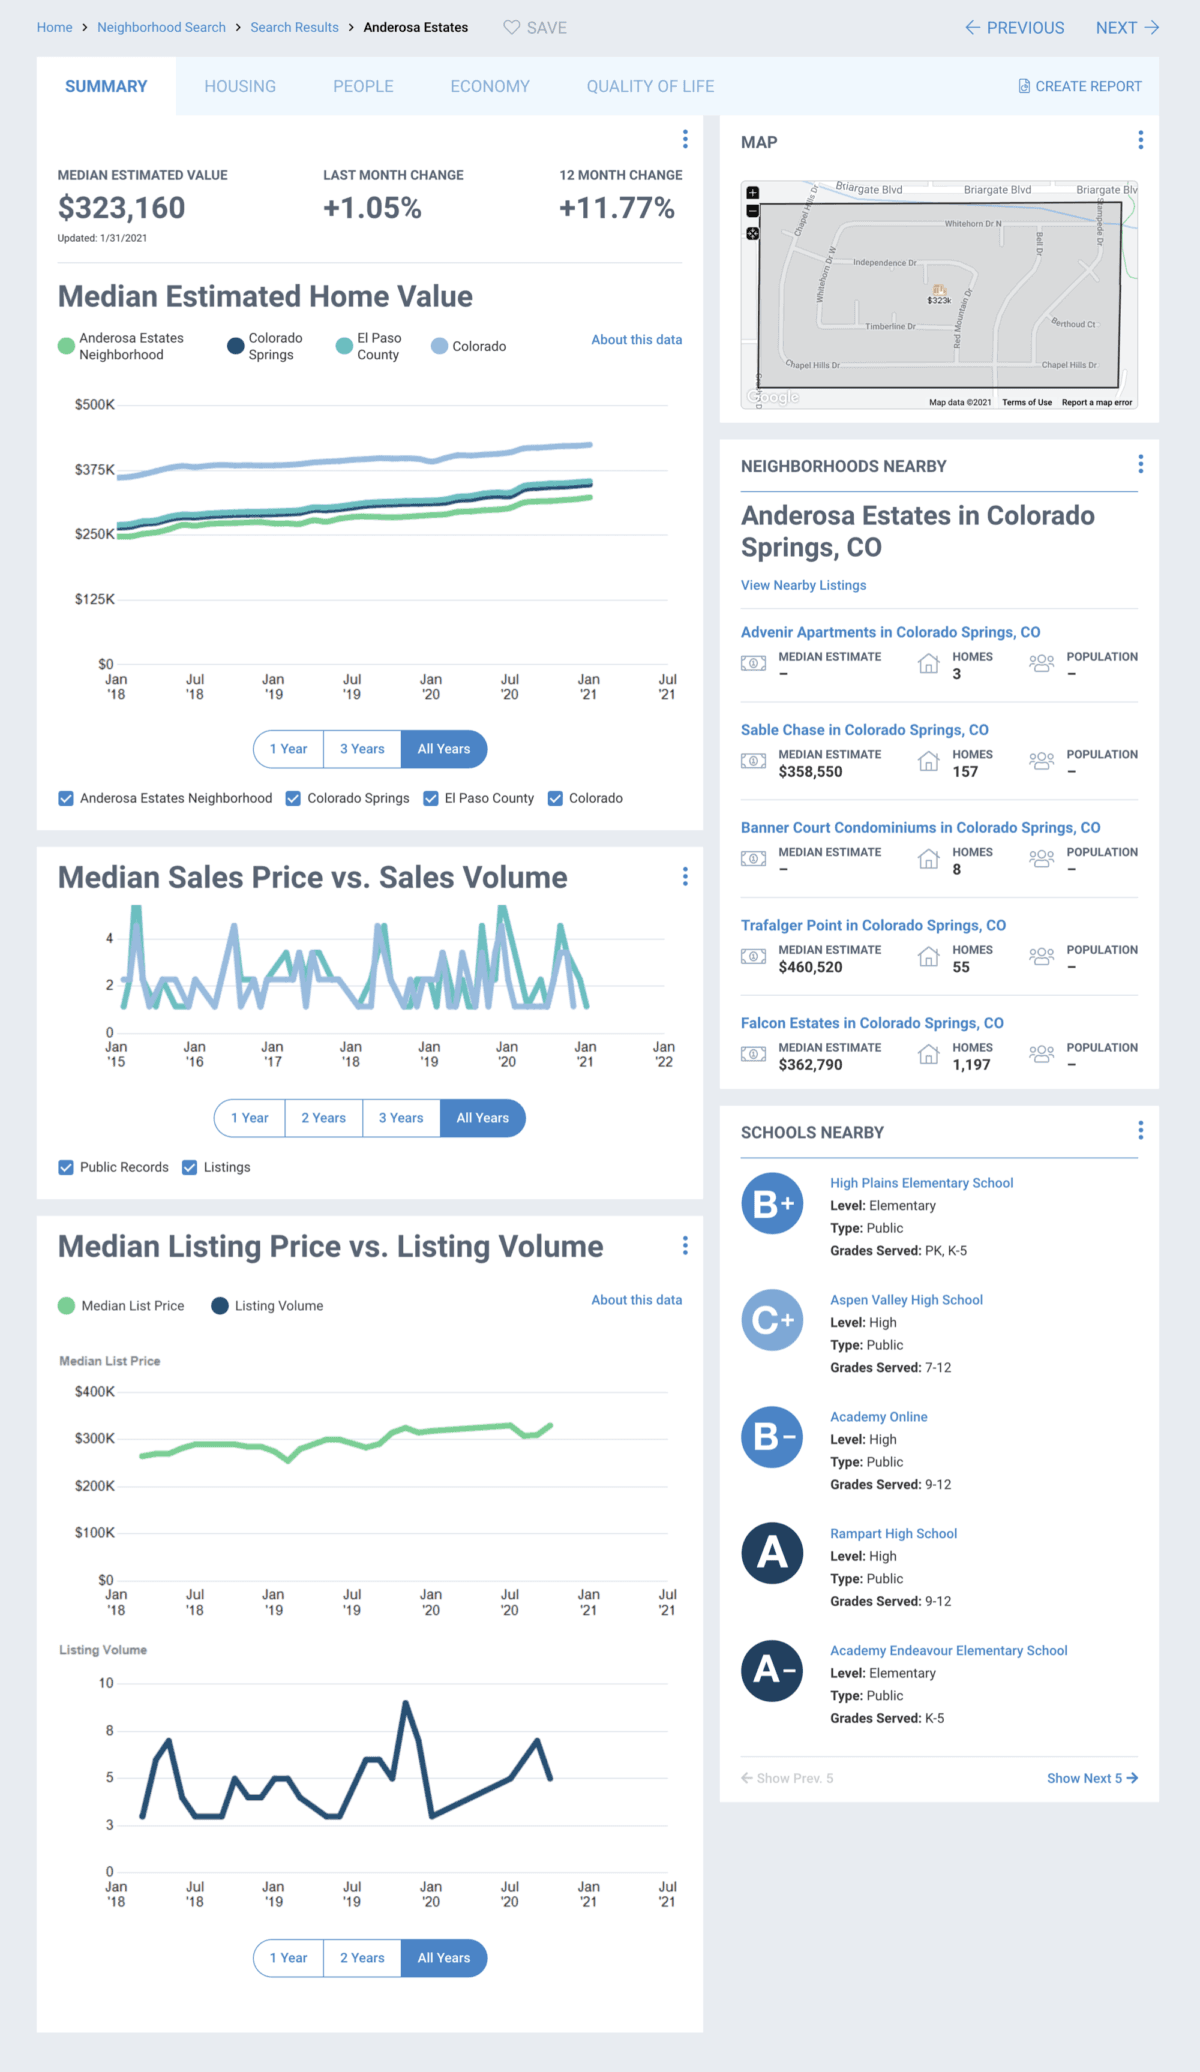
Summary
The Summary tab offers an overview of the area: the Median Estimated Home Value, including the estimated change over a one-month and 12-month period. You can also see the Median Sales Price vs. Sales Volume, Median Listing Price vs. Listing Volume, Population of Children by Age Group, and Population of Adults by Age Group.
Housing
The Housing tab highlights the neighborhood's housing characteristics compared to the county, state and nation, including comparisons for home ownership, rent, and information about permits and buildings. You'll also find easy-to-read graphs on the price, size, age, and number of bedrooms on homes sold in the area.
People
The People tab gets to the heart of who lives in the neighborhood. Here you will find a side-by-side comparison chart that measures population counts, densities and changes; median age, gender, and education levels. You'll also find breakdowns of population of children and adults by age group, the number of households with children, income brackets, occupations and even voting patterns.
Economy
Look to the Economy tab for a clear picture of per capita and median household incomes, as well as employment figures.
Quality of Life
This tab is particularly helpful when working with relocations. Look to Quality of Life for weather, commute times, transportation options, and water quality. It even includes the number of Superfund and Brownfield sites. Again, all in a side-by-side, neighborhood/county/state/country comparison.
How to Search a Neighborhood and Create a RPR Neighborhood Report?
The RPR Neighborhood Report summarizes economic, housing, demographic and quality of life information about an area. It's an in-depth portrait of the people who live in a target area, in addition to key indicators such as job growth, unemployment, cost of living, quality of life, commute times and climate. The report also includes median list and sales prices, listing and sales volumes, and per square foot pricing on sold homes.
Run your RPR Neighborhood Report:
- To begin, visit narrpr.com.
- Select Research from the homepage top navigation, and then choose Neighborhood Search.
- Enter a neighborhood, zip, city, or county.
- Select Exact, Within, or Nearby from the dropdown.
- Exact will take you directly to the searched area. You'll see five Neighborhood tabs: People, Housing, Economy, and Quality of life.
- Within allows you to choose from several neighborhoods.
- Nearby expands your results further.
- From the Neighborhood overview page, select Create Report.
- From the Reports page, confirm the Neighborhood Report is selected.
- Choose the specific elements to include or omit in the report by opening the below the name of the report type on the generation page.
- Choose the specific elements to include or omit on the report cover. These options are displayed in the right-hand sidebar, below the image of the report cover. Display your contact information, photo, logo and more. Show or hide page numbers.
- Personalize your report with a message.
- Choose a delivery method. Display the report as a PDF or email it to yourself or a client (or both). From the RPR app even text the report to your recipient.
- Press Run Report.
To view the original article, visit the RPR blog.