
RETECHNOLOGY PREMIUM MARKETPLACE RELATED PRODUCTS | WEBINARS | SPECIAL OFFERS


You are viewing our site as an Agent, Switch Your View:
Agent | Broker Reset Filters to Default Back to ListHome Prices Rising Twice as Fast in U.S. Cities with Highest Natural Hazard Risk Than in Lowest-Risk Cities
September 26 2017
Homeowners in highest-risk cities have more equity, longer homeownership tenures; appreciation slower in Florida and Louisiana cities with highest flood risk, bucking trend
IRVINE, Calif. – Sept. 21, 2017 — ATTOM Data Solutions, curator of the nation's largest multi-sourced property database, today released its 2017 U.S. Natural Hazard Housing Risk Index, which found that median home prices in U.S. cities in the 80th percentile for natural hazard risk (top 20 percent with highest risk) have increased more than twice as fast over the past five years and over the past 10 years than median home prices in U.S cities in the 20th percentile for natural hazard risk (bottom 20 percent with lowest risk).
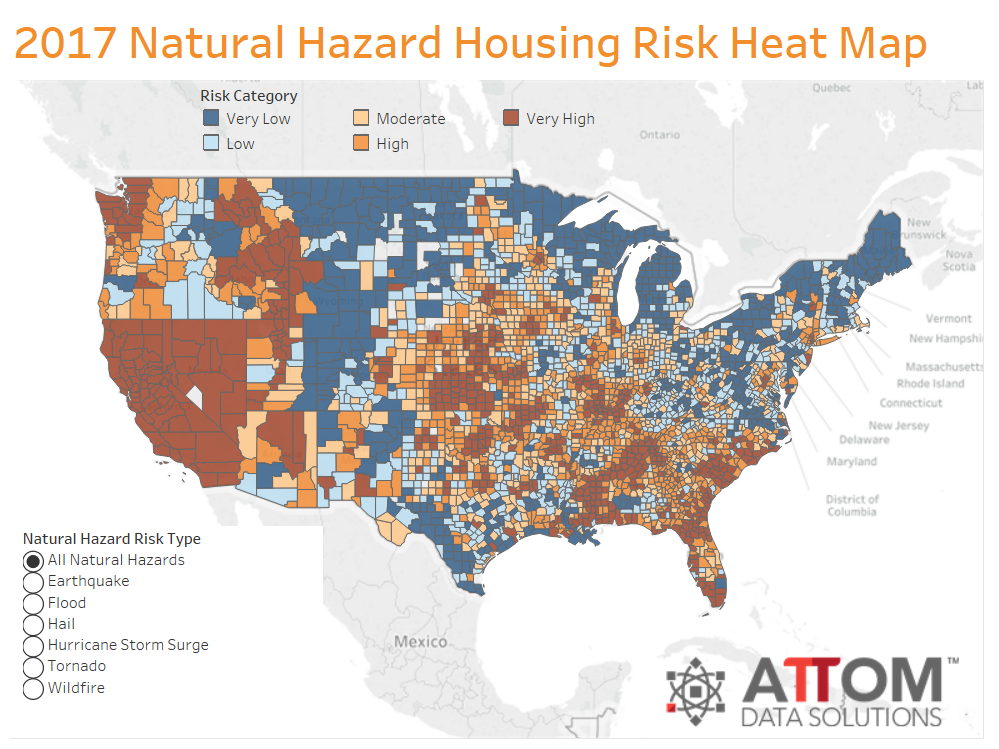
For the report ATTOM indexed natural hazard risk in more than 3,000 counties and more than 22,000 U.S. cities based on the risk of six natural disasters: earthquakes, floods, hail, hurricane storm surge, tornadoes, and wildfires. ATTOM also analyzed housing trends in 3,441 cities and 735 counties — containing more than 71 million single family homes and condos — broken into five equal quintiles of natural hazard housing risk (see full methodology below).
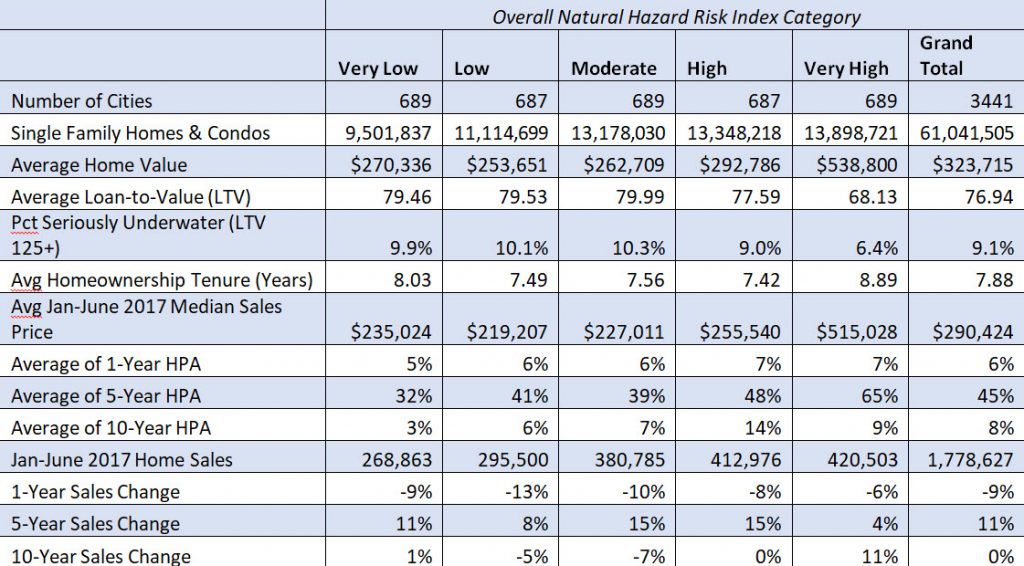
Median home prices in cities in the top 20 percent (Very High) for natural hazard risk have appreciated 65 percent on average over the past five years and 9 percent on average over the past 10 years while median home prices cities in the bottom 20 percent (Very Low) for natural hazard risk have appreciated 32 percent on average over the past five years and 3 percent on average over the past 10 years.
"Strong demand for homes in high-risk natural hazard areas has helped to accelerate price appreciation in those areas over the past decade despite the potential for devastating damage to homes that can be caused by a natural disaster — as evidenced by the recent hurricanes that made landfall in Texas and Florida," said Daren Blomquist, senior vice president at ATTOM Data Solutions. "That strong demand is driven largely by economic fundamentals, primarily the presence of good-paying jobs, although the natural beauty that often comes hand-in-hand with high natural hazard risk in these areas is also attractive to many homebuyers.
"There is some evidence in the data that real estate consumers in certain areas are beginning to more heavily factor natural hazard risk into their decisions, particularly when it comes to flood risk," Blomquist added. "Counter to the national trend, home price appreciation is slower in Florida and Louisiana cities with the highest flood risk than in cities with the lowest flood risk."
Appreciation slower in Florida and Louisiana Cities with highest flood risk
In the state of Florida, median home prices in cities with the highest flood risk were up 8 percent on average from a year ago and up 66 percent from five years ago while median prices in cities with the lowest flood risk were up 10 percent from a year ago and 70 percent from five years ago.
Median home prices in Florida cities with the highest hurricane storm surge risk were up 8 percent from a year ago and 47 percent from five years ago, while median prices in cities with the lowest hurricane storm surge risk were up 11 percent from a year ago and up 67 percent from five years ago.
There was a similar trend in relation to flood risk in the state of Louisiana, which experienced damaging floods in August 2016. Median home prices in Louisiana cities with the highest flood risk were down 20 percent from a year ago and up 2 percent from five years ago while median home prices in the lowest risk cities increased 5 percent over the past year and increased 37 percent over the past five years.
Homeowners in highest-risk cities have more equity, longer homeownership tenures
Homeowners in cities in the top 20 percent for natural hazard risk have 32 percent home equity on average compared to 21 percent home equity on average for homeowners in cities in the bottom 20 percent for natural hazard risk.
Seriously underwater homes (LTV of 125 percent or higher) account for 6.4 percent of all homes in cities in the top 20 percent for natural hazard risk compared to a seriously underwater rate of 9.9 percent on average for homes in cities in the bottom 20 percent for natural hazard risk.
Homeowners who sold in the first six months of 2017 had owned for an average of 8.89 years in cities in the top 20 percent for natural hazard risk compared to an average homeownership tenure of 8.03 years in cities in the bottom 20 percent for natural hazard risk.
Counties and cities with highest natural hazard risk index
Among the 735 U.S. counties included in the housing trends analysis, those with the highest overall natural hazard index were Oklahoma County, Oklahoma; Wakulla County (Tallahassee), Florida; Monroe County (Key West), Florida; Cleveland County (Oklahoma City), Oklahoma; and Nevada County (Truckee), California.
Among 50 U.S. cities included in the analysis with a population of at least 500,000, those with the highest overall natural hazard housing risk index were Oklahoma City, Oklahoma; San Jose, California; Los Angeles, California; Bakersfield, California; and Seattle, Washington.
Counties and cities with lowest natural hazard risk index
Among the 735 U.S. counties included in the housing trends analysis, those with the lowest overall natural hazard index were Milwaukee County (Milwaukee), Wisconsin; Cuyahoga County (Cleveland), Ohio; Muskegon County (Muskegon), Michigan; and Lake County (Cleveland), Ohio.
Among 50 U.S. cities included in the analysis with a population of at least 500,000, those with the lowest overall natural hazard housing risk index were Philadelphia, Pennsylvania; Phoenix, Arizona; Buffalo, New York; Orlando, Florida; and Brooklyn, New York.
About ATTOM Data Solutions
ATTOM Data Solutions is the curator of the ATTOM Data Warehouse, a multi-sourced national property database that blends property tax, deed, mortgage, foreclosure, environmental risk, natural hazard, health hazards, neighborhood characteristics and other property characteristic data for more than 150 million U.S. residential and commercial properties. The ATTOM Data Warehouse delivers actionable data to businesses, consumers, government agencies, universities, policymakers and the media in multiple ways, including bulk file licenses, APIs and customized reports.