
RETECHNOLOGY PREMIUM MARKETPLACE RELATED PRODUCTS | WEBINARS | SPECIAL OFFERS


You are viewing our site as a Broker, Switch Your View:
Agent | Broker Reset Filters to Default Back to ListHome Prices Boom 10 Years After Housing Crisis
November 13 2017
New report reveals surprising data as prices return to bubble levels
SANTA CLARA, Calif., Nov. 13, 2017 -- Home prices have returned to the boom levels of a decade ago -- which foreshadowed the bursting of the real estate "bubble" and the onset of The Great Recession -- but today's housing market is starkly different, according to data released today from realtor.com®, a leading online real estate destination. Backed by tighter lending standards and more solid economic fundamentals, current price appreciation is being driven by strong supply-and-demand dynamics with no signs of boom era flipping or over-construction.
On the surface, today's housing market looks suspiciously similar to the pre-recession years with rising home prices and feverish buyer demand. However, a deeper analytical assessment reveals material differences -- historically low inventory levels, much tighter lending standards and significant job and household growth -- and a strong housing market backed by economic fundamentals.
Home Prices are Soaring
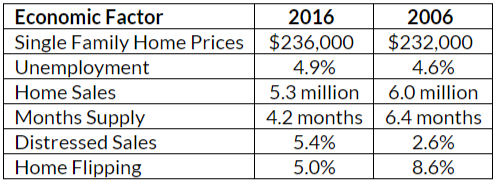
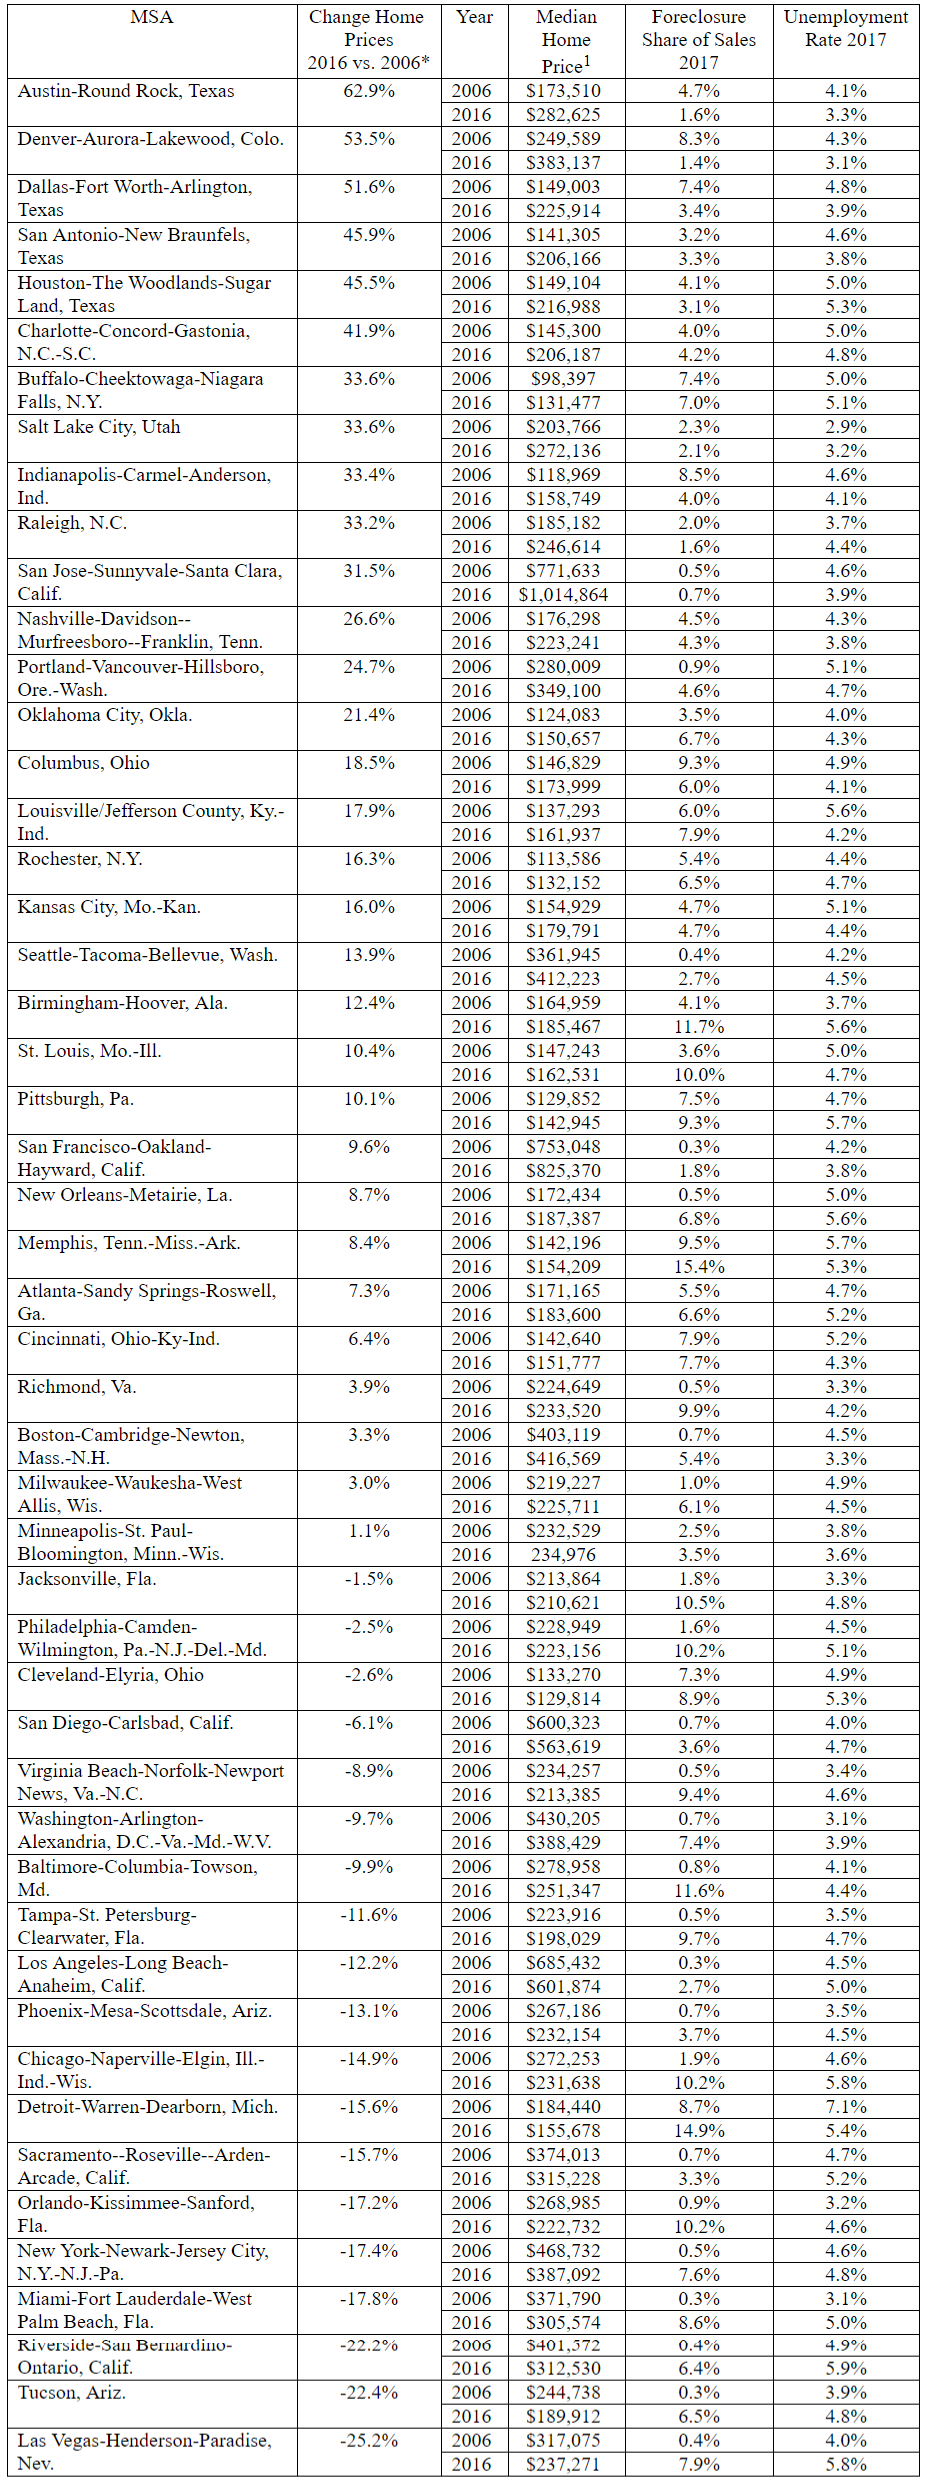
The U.S. median home sales price in 2016 was $236,000, 2 percent higher than in 2006.1 In fact, 31 of the 50 largest U.S. metros are back to pre-recession price levels. Austin, Texas, has seen the largest price growth in the last decade with a 63 percent increase.1 It's followed by Denver, at 54 percent and Dallas at 52 percent. Three markets -- Las Vegas, Tucson, Ariz., and Riverside, Calif., -- remained more than 20 percent below 2006 price levels at the end of 2016, at 25 percent, 22 percent and 22 percent, respectively.1 Additionally, realtor.com® national data shows that listing prices have been up double-digits for the majority of 2017.
"As we compare today's market dynamics to those of a decade ago, it's important to remember rising prices didn't cause the housing crash," said Danielle Hale, chief economist for realtor.com®. "It was rising prices stoked by subprime and low documentation mortgages, as well as people looking for short term gains -- versus today's truer market vitality -- that created the environment for the crash."
Lending Standards are Tight
The largest difference in the last decade is that lending standards are the tightest they have been in almost 20 years. Today, the Dodd-Frank Wall Street Reform and Consumer Protection Act requires loan originators to show verified documentation that a borrower is able to repay the loan. As a result, the median 2017 home loan FICO score was 734, significantly up from 700 in 2006, on a scale of 330 – 830.2
The bottom 10 percent of borrowers also have much higher credit scores with a FICO of 649 in 2017, from 602 in 2006.2 While veterans and others with specialized mortgages can still put zero percent down, these mortgages include additional restrictions to ensure they can be paid back.
"Lending standards are critical to the health of the market," added Hale. "Unlike today, the boom's under-regulated lending environment allowed borrowing beyond repayable amounts and atypical mortgage products, which pushed up home prices without the backing of income and equity."
Flipping and Over-Building Are in Check
A decade ago, the widespread belief that prices could never go down spurred rampant home flipping and building. Today, tight lending standards have kept flipping and over-building in check, but are contributing to severely constrained construction levels.
Prior to the crash, flipping became increasingly mainstream with amateur flippers taking on multiple loans. In 2006, the share of flipped homes reached 8.6 percent of all sales, exceeding 20 percent in some metros such as Washington, D.C. and Chicago.3 With today's tight lending environment limiting borrowing power, flipping accounted for 5 percent of sales in 2016, a more restrained level.3
Over-building was another indicator of the unhealthy market conditions in the early 2000s. As prices rose, builders kept building, regardless of demand. In 2006, there were 1.4 single-family housing starts for every household formed, well above the healthy level of one necessary to keep up with the market.4 Today's market is well below normal construction levels at only 0.7 single-family household starts per household formation.4 While the lack of over-building is generally positive for the market, the current environment of under-building is having a material impact on supply and escalating prices.
Today's Home Prices Driven by Economic Fundamentals
Strong employment and demand paired with severely limited supply is driving price escalation today. Employment was also strong in 2006, but years of over-building put an oversupply drag on the market.
In October 2017, unemployment is now at 4.1 percent -- a 17-year low, with more than 150,000 jobs created on average each month in 2017.5 In 30 of the 50 largest U.S. metros, unemployment is less than half of 2010 levels.5 In 2016, there were 8 million more workers on payrolls than in 2006 and 10 million more households.5 At the same time, there are 600,000 fewer total housing starts and nearly 700,000 fewer single-family housing starts.4
Hale added, "The healthy economy is creating more jobs and households, but not giving these people enough places to live. Rapid price increases will not last forever. We expect a gradual tapering as buyers are priced out of the market - not a market correction, but an easing of demand and price growth as renting or adding roommates becomes a more affordable alternative."
Millennial job growth has also contributed to rising demand. In September, employment reached 79 percent in the 25-34 age group, back up to 2006 levels and 5 percent higher than 2010. In fact, millennials made up 52 percent of home shoppers this past spring and with the largest cohort of millennials expected to turn 30 in 2020, their demand for homes is only expected to increase.
On top of escalating demand, the supply of homes available also is significantly constrained. In 2016, single-family inventory reached a 22-year historic low at 1.45 million homes for sale.6 October 2017 marked the 26th consecutive month of year-over-year declines in realtor.com inventory. The market is currently averaging 4.2 months supply, which is significantly faster than 2007's 6.4 months supply.6 Vacancies also are very tight with for-sale vacancies dropping to 1.3 million in 2016, compared to 1.9 million in 2006. Rental vacancies hit 3.2 million in 2016, compared to 3.7 in 2006.7
- Single-family home price sales - NAR/Moody's Analytics Estimates
- Urban Institute
- Corelogic
- U.S. Census Bureau - Moody's Analytics Estimates
- Bureau of Labor Statistics
- National Association of Realtors
- Census, Housing Vacancy Survey
Largest 50 Markets Price Appreciation Since 2006
About realtor.com®
Realtor.com® is the trusted resource for home buyers, sellers and dreamers, offering the most comprehensive source of for-sale properties, among competing national sites, and the information, tools and professional expertise to help people move confidently through every step of their home journey. It pioneered the world of digital real estate 20 years ago, and today helps make all things home simple, efficient and enjoyable. Realtor.com® is operated by News Corp [NASDAQ: NWS, NWSA] [ASX: NWS, NWSLV] subsidiary Move, Inc. under a perpetual license from the National Association of REALTORS®. For more information, visit realtor.com®.