
RETECHNOLOGY PREMIUM MARKETPLACE RELATED PRODUCTS | WEBINARS | SPECIAL OFFERS


You are viewing our site as an Agent, Switch Your View:
Agent | Broker Reset Filters to Default Back to ListHUD and Census Bureau Report Residential Construction Activity in June 2019
July 17 2019
WASHINGTON (July 17, 2019) - The U.S. Department of Housing and Urban Development (HUD) and the U.S. Census Bureau jointly announced the following new residential construction statistics for June 2019.
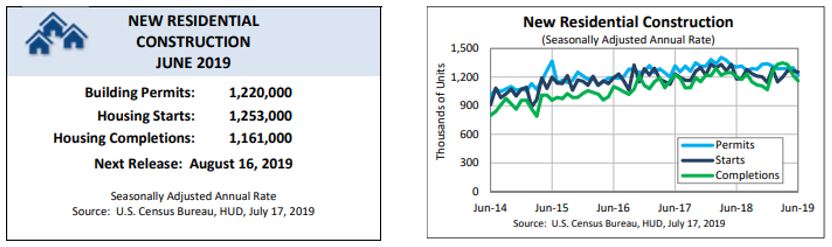
Building Permits
Privately owned housing units authorized by building permits in June were at a seasonally adjusted annual rate of 1,220,000. This is 6.1 percent (±1.2 percent) below the revised May rate of 1,299,000 and is 6.6 percent (±1.1 percent) below the June 2018 rate of 1,306,000. Single‐family authorizations in June were at a rate of 813,000; this is 0.4 percent (±1.0 percent)* above the revised May figure of 810,000. Authorizations of units in buildings with five units or more were at a rate of 360,000 in June.
Housing Starts
Privately owned housing starts in June were at a seasonally adjusted annual rate of 1,253,000. This is 0.9 percent (±7.9 percent)* below the revised May estimate of 1,265,000, but is 6.2 percent (±7.8 percent)* above the June 2018 rate of 1,180,000. Single‐family housing starts in June were at a rate of 847,000; this is 3.5 percent (±9.6 percent)* above the revised May figure of 818,000. The June rate for units in buildings with five units or more was 396,000.
Housing Completions
Privately‐owned housing completions in June were at a seasonally adjusted annual rate of 1,161,000. This is 4.8 percent (±12.8 percent)* below the revised May estimate of 1,220,000 and is 3.7 percent (±10.5 percent)* below the June 2018 rate of 1,205,000. Single‐family housing completions in June were at a rate of 870,000; this is 1.8 percent (±11.5 percent)* below the revised May rate of 886,000. The June rate for units in buildings with five units or more was 283,000.
Read more about new residential construction activity.
Explanatory Notes
In interpreting changes in the statistics in this release, note that month-to-month changes in seasonally adjusted statistics often show movements which may be irregular. It may take three months to establish an underlying trend for building permit authorizations, six months for total starts, and six months for total completions. The statistics in this release are estimated from sample surveys and are subject to sampling variability as well as nonsampling error including bias and variance from response, nonreporting, and undercoverage. Estimated relative standard errors of the most recent data are shown in the tables. Whenever a statement such as “2.5 percent (±3.2 percent) above” appears in the text, this indicates the range (-0.7 to +5.7 percent) in which the actual percentage change is likely to have occurred. All ranges given for percentage changes are 90 percent confidence intervals and account only for sampling variability. If a range does not contain zero, the change is statistically significant. If it does contain zero, the change is not statistically significant; that is, it is uncertain whether there was an increase or decrease. The same policies apply to the confidence intervals for percentage changes shown in the tables. On average, the preliminary seasonally adjusted estimates of total building permits, housing starts and housing completions are revised 3 percent or less. Explanations of confidence intervals and sampling variability can be found at the Census Bureau’s website.
* The 90 percent confidence interval includes zero. In such cases, there is insufficient statistical evidence to conclude that the actual change is different from zero.