
RETECHNOLOGY PREMIUM MARKETPLACE RELATED PRODUCTS | WEBINARS | SPECIAL OFFERS


You are viewing our site as an Agent, Switch Your View:
Agent | Broker Reset Filters to Default Back to ListMedian-Priced Homes Remain Unaffordable for Average Wage Earners in 74 Percent of U.S. Housing Markets
September 30 2019
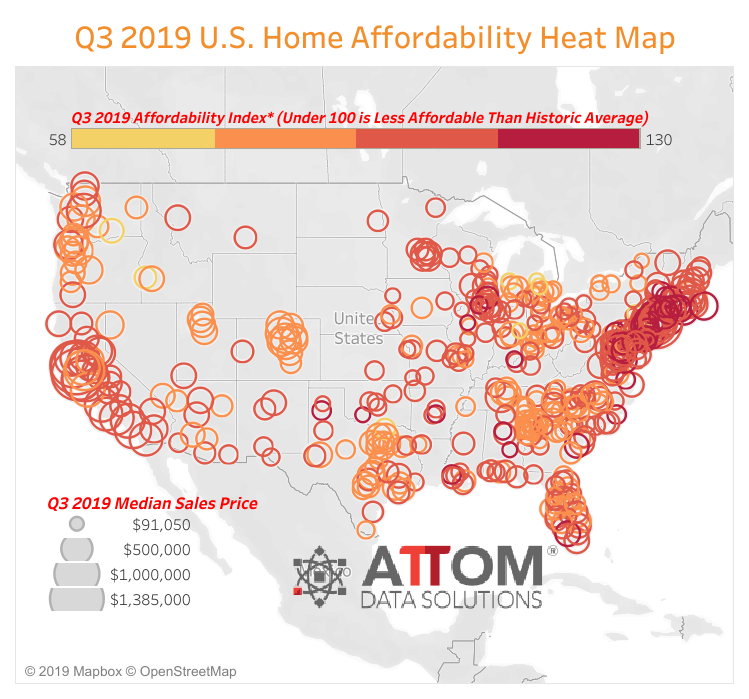
Rising Home Prices Outpacing Wages in 76 percent of U.S. Housing Markets; Home Prices Less Affordable Than Historic Average in 61 Percent of Local Markets
IRVINE, Calif. - Sept. 26, 2019 -- ATTOM Data Solutions, curator of the nation's premier property database and first property data provider of Data-as-a-Service (DaaS), today released its Q3 2019 U.S. Home Affordability Report, which shows that median home prices in the third quarter of 2019 were not affordable for average wage earners in 371 of 498 U.S. counties analyzed in the report (74 percent).
The largest populated counties where a median-priced home in the third quarter of 2019 was not affordable for average wage earners included Los Angeles County, CA; Cook County (Chicago), IL; Maricopa County (Phoenix), AZ; San Diego County, CA and Orange County, CA. Those same counties were in the top five in Q2 2019.
The 127 counties (26 percent of the 498 counties analyzed in the report) where a median-priced home in the third quarter of 2019 was still affordable for average wage earners included Harris County (Houston), TX; Wayne County (Detroit), MI; Philadelphia County, PA; Cuyahoga County (Cleveland), OH; and Allegheny County (Pittsburgh), PA.
The report determined affordability for average wage earners by calculating the amount of income needed to make monthly house payments — including mortgage, property taxes and insurance — on a median-priced home, assuming a 3 percent down payment and a 28 percent maximum "front-end" debt-to-income ratio. That required income was then compared to annualized average weekly wage data from the Bureau of Labor Statistics (see full methodology below).
"Buying a home continues to be a rough road to navigate for the average wage earner in the United States. Prices are going up substantially faster than earnings in 2019 without any immediate end in sight, which continues to make home ownership difficult or impossible for a majority of single-income households and even for many families with two incomes," said Todd Teta, chief product officer with ATTOM Data Solutions. "If there is any silver lining to the picture, it's that mortgage rates have fallen back to historic lows. That's softening the blow of rising prices and actually making home ownership a bit more attainable in most areas of the country."
Home price appreciation outpacing wage growth in 76 percent of markets
Home price appreciation outpaced average weekly wage growth in 379 of the 498 counties analyzed in the report (76 percent), including Westchester County (New York), NY; Los Angeles County, CA; Suffolk County (Boston), MA; Arlington County (Washington), VA; and Monterey County (Salinas), CA.
Average annualized wage growth outpaced home price appreciation in 119 of the 498 counties analyzed in the report (24 percent), including San Diego County, CA; Orange County (Los Angeles), CA; Miami-Dade County, FL; Kings County (Brooklyn), NY and Queens County, NY.
67 percent of markets require at least 30 percent of wages to buy a home
Among the 498 counties analyzed in the report, 335 (67 percent) require at least 30 percent of their annualized weekly wages to buy a home in the third quarter of 2019. Those counties that required the greatest percent included Kings County (Brooklyn), NY (110.4 percent of annualized weekly wages needed to buy a home); Santa Cruz County, CA (105 percent); Marin County (San Francisco), CA (102.4 percent); Maui County, HI (87.9 percent); and Monterey County, CA (87.5 percent).
A total of 163 of the 498 counties analyzed in the report (33 percent) required less than 30 percent of their annualized weekly wages to buy a home in the third quarter of 2019. Those counties that required the smallest percent included Calhoun County (Battle Creek), MI (14.4 percent of annualized weekly wages needed to buy a home); Wayne County (Detroit), MI (14.9 percent); Clayton County (Atlanta), GA (15.2 percent); Rock Island County (Davenport), IL (15.5 percent); and Montgomery County, AL (16.2 percent).
61 percent of markets less affordable than historic averages
Among the 498 counties analyzed in the report, 304 (61 percent) were less affordable than their historic affordability averages in the third quarter of 2019, down from 70 percent of counties in the previous quarter and 73 percent of counties in the third quarter of 2018.
Counties with a population greater than 1 million and that were less affordable than their historic affordability averages (indexes of less than 100 are considered less affordable compared to their historic averages) included Los Angeles County, CA (index of 96); Harris County (Houston), TX (89); Maricopa County (Phoenix), AZ (93); Orange County, CA (99); and Miami-Dade County, FL (98).
Counties with the lowest affordability index were Delaware County (Philadelphia), PA (index of 58); Lackawanna County (Scranton), PA (68); Genesee County (Flint), MI (69); Delaware County (Muncie), IN (69); and Saginaw County, MI (72).
39 percent of markets more affordable than historic averages
Among the 498 counties analyzed in the report, 194 (39 percent) were more affordable than their historic affordability averages in the third quarter of 2019, including Cook County (Chicago), IL; San Diego County, CA; Queens County, NY; King County (Seattle), WA; and Santa Clara County (San Jose), CA.
Counties with the highest affordability index (indexes of more than 100 are considered more affordable compared to their historic averages) were Onslow County (Jacksonville), NC (130); Clark County (Louisville, KY), IN (128); Atlantic County (Atlantic City), NJ (127); Cumberland County (Vineland), NJ (126); Litchfield County (Torrington), CT (124); and Warren County (Stroudsburg), NJ (124).
About ATTOM Data Solutions
ATTOM Data Solutions provides premium property data to power products that improve transparency, innovation, efficiency and disruption in a data-driven economy. ATTOM multi-sources property tax, deed, mortgage, foreclosure, environmental risk, natural hazard, and neighborhood data for more than 155 million U.S. residential and commercial properties covering 99 percent of the nation's population. A rigorous data management process involving more than 20 steps validates, standardizes and enhances the data collected by ATTOM, assigning each property record with a persistent, unique ID — the ATTOM ID. The 9TB ATTOM Data Warehouse fuels innovation in many industries including mortgage, real estate, insurance, marketing, government and more through flexible data delivery solutions that include bulk file licenses, APIs, real estate market trends, marketing lists, match & append and introducing the first property data deliver solution, a cloud-based data platform that streamlines data management – Data-as-a-Service (DaaS).