
RETECHNOLOGY PREMIUM MARKETPLACE RELATED PRODUCTS | WEBINARS | SPECIAL OFFERS


You are viewing our site as a Broker, Switch Your View:
Agent | Broker Reset Filters to Default Back to ListStatic Data Can Be Boring and Stale. This Tool Can Make It Fresh!
December 29 2015
Do you want to make the information you share with your sphere of influence DANCE? Consider utilizing Infogr.am to create dynamic infographics. With Infogram's interactive visualizations, you are literally adding a new dimension of engagement with your communications.
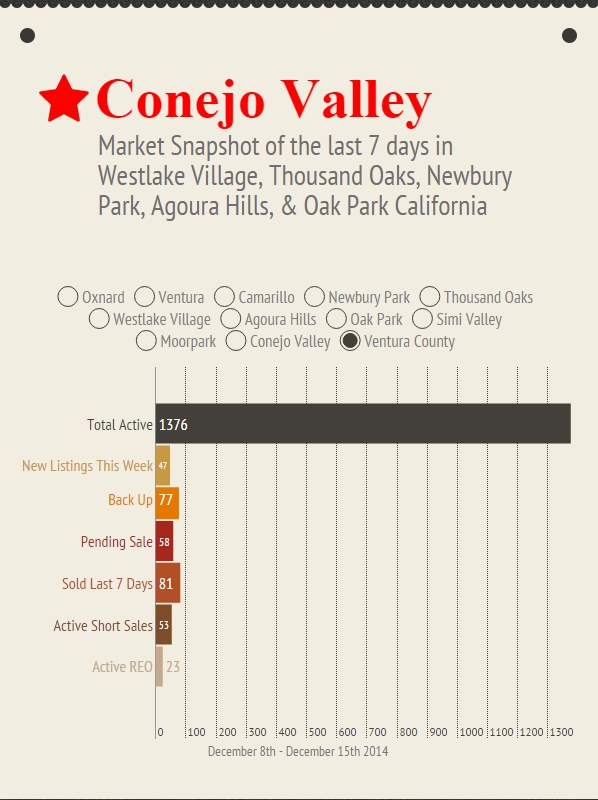
Top producing real estate professionals are already leveraging this data visualization product to improve engagement with their clients and potential clients. A very productive Realtor in Southern California uses infogr.am's free option to distribute information to his customer database on how the real estate market is performing locally (thank you Tristan for sharing). Here is an example (click to view the full interactive version):
To learn what is included with the free version and find out what is included with the two paid options, go to this link.
The folks at infogr.am claim, "Our infographics and charts are quick to use, fast to share, and easy on eye," and Tech Savvy Agent would have to agree with that statement. Additionally, the free version does provide plenty of options to create infographics that would blow away a typed out (black and white) communication. To learn more please visit:

Thanks for checking out this post and let us know in the comments what you are creating with Infogr.am!
To view the original article, visit the Tech Savvy Agent blog.